The coming of the 5G, IoT and AI era is expected to create large amounts of data that need to be stored and processed, spurring the growth of the server market. An increasing number of enterprises are making use of cloud servers instead of building their dedicated server infrastructure to save up-front investment and operating costs. This will spur growth in server demand by cloud service providers including Amazon, Microsoft and Google, who are now making more purchases directly from Taiwan-based white-box or brand vendors, putting pressure on the traditional server brands Dell and HP, who are estimated to see only 2% to 3% shipment growth in 2017.
Taiwan's server suppliers have been playing a key role in the market. Taiwan's server industry has been transitioning from simply making motherboards to providing downstream complete server systems. Having accumulated R&D capabilities during the transition, Taiwan-based server manufacturers will keep advancing toward the development of software integration and total solutions to enhance their technological edge. Taiwan-based manufacturers' share of global server shipments will remain above 90% through 2022.
Of the major suppliers, the top-2, Inventec and Wistron (including Wiwynn) have been neck and neck in terms of shipment volume, each shipping an estimated volume of 2.6 million servers in 2017 and their shipments will both grow in 2018, with Inventec taking a narrow lead.
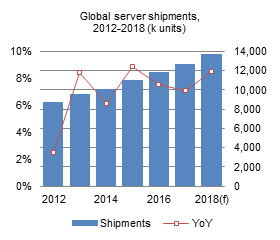
In 2018, global server shipments will grow 8.5% to reach 13.73 million units. Digitimes Research estimates server shipments worldwide will grow at a CAGR of 6.5% during the period 2017-2022, with growth mainly driven by large-scale data centers and the China market.
The Special Report on the server industry offers shipment forecasts for 2018, as well as market outlook till 2022.
Chart 5: Global server shipments by vendor location, 2012-2018 (k units)
Chart 6: Global server shipments by vendor, 2015-2017 (k units)
Chart 7: Taiwan server motherboard shipments, 2015-2018 (k units)
Chart 8: Server motherboard shipments by Taiwan top-5 maker, 2015-2018 (k units)
Chart 9: Server motherboard shipment share by Taiwan top-5 maker, 2015-2018
Chart 11: Shipment proportion of major server makers to clients, 2017
Chart 12: Server revenues as share of total Inventec revenues, 2015-2018
Chart 13: Inventec server motherboard shipments, 2015-2018 (k units)
Chart 14: Inventec server motherboard shipments by customer, 2015-2017 (k units)
Chart 15: Server revenues as share of total Wistron revenues, 2015-2018
Chart 16: Wistron server motherboard shipments, 2015-2018 (k units)
Chart 17: Wistron server motherboard shipments by customer 2015-2017 (k units)
Chart 18: Server revenues as share of total Foxconn revenues, 2015-2018
Chart 20: Foxconn server motherboard shipments by customer, 2015-2017 (k units)
Chart 21: Server revenues as share of total Quanta revenues, 2015-2018
Chart 23: Quanta server motherboard shipments by customer, 2015-2017 (k units)
Chart 24: Server revenues as share of total Mitac revenues, 2015-2018
Chart 25: Mitac server motherboard shipments, 2015-2018 (k units)
Chart 26: Mitac server motherboard shipments by customer, 2015-2017 (k units)
Chart 27: Cloud computing sector share in server market, 2006-2021
Chart 29: Global server shipments by vendor location, 2014-2022 (k units)
Chart 30: Global server shipment share by vendor location, 2014-2022
Chart 31: Taiwan server motherboard shipments, 2015-2022 (k units)