Subscribe to Research Taiwan FPD Tracker or Taiwan Display System Tracker to read this report or purchase it separately. Subscribe Now
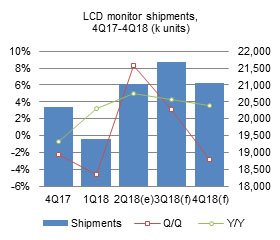
 Taiwan's monitor shipments grew 5% on year to reach 21.03 million units in the second quarter of 2018.
 Taiwan's monitor shipments grew 5% on year to reach 21.03 million units in the second quarter of 2018.