

Subscribe to Research Taiwan FPD Tracker to read this report or purchase it separately. Subscribe Now
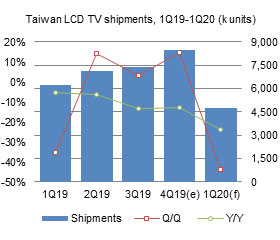 Because of seasonal pickup in demand, Taiwan's TV shipments grew 14.7% sequentially in the fourth quarter of 2019, but still slipped 12.6% on year.
Table of contents