
The PV market saw burgeoning demand in 2010. The boom in the German market during the first half of the year was followed by a boom in Italy during the second half, with demand outstripping supply throughout 2010. Digitimes Research estimates that total global new PV system installations reached 18.2GWp in 2010.
Major reductions in subsidy levels are occurring across the major European PV markets in 2011. As European markets account for 80% of global demand, this will have a decisive effect on supply and demand in the global PV industry. However, the PV markets of India, the US, Canada, Australia and other countries also have a great deal of growth momentum, which could even be sufficient to offset the impact of weakening European demand. Digitimes Research estimates that, spurred on by emerging PV markets, the global PV market will reach 21.5GWp, representing 17.8% growth on the 2010 figure.
The PV industry spent the entirety of 2010 coping with shortfalls in supplies, driving many firms to proactively expand capacity in response. As the trend towards relocating manufacturing to the Asia region continues unabated, China and Taiwan-based firms have also actively expanded capacity. Digitimes Research calculates that based on the various manufacturers' capacity expansion plans, global PV silicon wafer capacity will reach 50.9GWp by the end of 2011, equivalent to 62.1% growth on the 2010 figure; while total c-Si solar cell capacity will reach 60.6GWp in 2011, a 90.6% increase on the preceding year.
Policy and market development in the major global PV markets
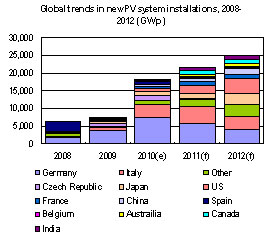
Chart 1: Global trends in new PV system installations, 2008-2012 (GWP)
Chart 2: German solar power FiT rate reduction trends, 2009-2011 (EUR/unit)
Table 1: Germany's midyear 2011 solar power FiT rate reductions plans (EUR/unit)
Chart 3: German PV market installation volumes, 2006-2012 (MWp)
Table 2: Italy subsidy and installation caps for large solar power systems, 2H11-2H16
Chart 4: Trends and forecasts for Italy's PV market, 2006-2012 (MWp)
Chart 5: Trends and forecasts for the Czech PV market, 2007-2012 (MWp)
Table 7: Comparison of Spain's solar FiT rates for 2010 and 2011 (MWp)
Chart 8: Europe as a proportion of the global PV market, 2007-2012
Table 8: Comparison of Japan's PV subsidies in 2010 and 2011 (JPY)
Chart 10: Breakdown of demand in the China PV market during 2011
Chart 12: New PV system installations in India, 2007-2012 (MWp)
Chart 13: New installations in Australia's solar power market, 2006-2012 (MWp)
Chart 14: New installations in the US solar power market, 2006-2012 (MWp)
Table 11: FiT rates in the Canadian province of Ontario, 2011
Chart 15: Global c-Si solar cell production capacity, 2009-2011 (MWp)
Chart 16: c-Si solar cell capacity distribution, 4Q10 and 4Q11 (MWp)
Table 12: Global c-Si solar cell manufacturers whose capacity will exceed 1GW in 2011 (MWp)
Chart 18: Global distribution of PV silicon wafer capacity, 4Q10 and 4Q11 (MWp)
Table 13: Global manufacturers whose PV silicon wafer capacity will exceed 1GW in 2011 (MWp)
Chart 19: Global trends in polysilicon factory capacity, 2009-2012 (Mt)
Table 14: Capacity expansion plans for the 8 major polysilicon manufacturers, 2009-2014 (Mt)
Table 15: CIGS PV process technology routes and corresponding manufacturers
Table 16: Projected demand in major global PV markets, 2009-2012
Chart 23: Supply/demand bottlenecks in the solar PV industry
Table 17: Global polysilicon supply forecasts, 2009-2012 (Mt)
Chart 26: PV market trends, 2007-2012 (GWp, annual growth %)
Analysis of development trends in the China and Taiwan PV industries
Table 18: Vertically-integrated China-based PV firms capacity targets, 2011 (1)
Table 19: Vertically-integrated China-based PV firms capacity targets, 2011 (2)
Table 20: Taiwan-based firms form strategic alliances to achieve vertical integration
Table 21: China-based polysilicon firms' capacity plans, 2009-2012 (Mt)
Chart 30: Polysilicon firms with 10,000Mt or greater capacity can be divided into two categories
