
Asia-based LED chip manufacturers from South Korea, Taiwan and China are adding new equipment, with the result being that the world's two largest MOCVD machinery manufacturers - Aixtron and Veeco, who together combine for a global market share of 95% - are seeing the Asia region become the biggest contributor to their revenues. But with demand for MOCVD machinery increasing, South Korea plans to move toward independently developing MOCVD equipment.
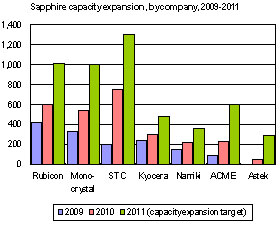
In addition, upstream sapphire manufacturers were more conservative about expanding capacity in 2010 than MOCVD machinery makers, resulting in shortfalls in supply. Sapphire manufacturers maintain a favorable demand growth outlook for sapphire substrates in 2011, and consequently the world's seven largest manufacturers will increase capacity by close to 100% this year.
Asia will especially drive demand, with emerging LED manufacturers such as Samsung LED, LG Innotek and Lextar, and established manufacturers such as Nichia and Toyoda, contributing to helping the Asia region become the world's major manufacturing s region. In addition, China's subsidy policies for MOCVD machinery mean that the development of China-based firms like Sanan and Elec-Tech (ETi) will be even more worthy of attention.
Questions answered in this report:
What will MOCVD capacity be in 2011?
What are the plans of sapphire players?
Who are the main players in the upstream LED Industry?
Chart 1: Demand for MOCVD equipment for LED applications, 2006-2011 (units)
Chart 4: LED as a share of Aixtron revenues, 2008-2009 and 1Q10-3Q10
Chart 5: Aixtron revenue share breakdown by region, 2009 and 1Q10-3Q10
Chart 7: Aixtron LED equipment order values, 1Q09-3Q10 (US$m)
Chart 8: Aixtron revenues and book-to-bill ratio, 1Q09-3Q10, (US$m)
Chart 11: Veeco LED & Solar Department financials, 4Q09-4Q10 (US$m)
Chart 12: Veeco LED & Solar Department book-to-bill ratio, 4Q09-4Q10
Chart 13: Veeco revenues by geographic region, 2008- 3Q2010 (US$m)
Chart 14: China sales of Veeco MOCVD equipment by customer type
Chart 15: LED chip demand forecast by market segment, 2010-2015 (billion)
Chart 19: TN Sanso mid-term business focuses and MOCVD targets
Chart 20: TN Sanso MOCVD revenue forecast, Fiscal Year 2012 (JPYm)
Chart 21: Samsung LED and LG Innotek MOCVD capacity, 2009-2011 (sets)
Chart 22: Samsung LED MOCVD equipment for LED TVs, 2009-2011 (cumulative sets)
Chart 23: LG Innotek MOCVD equipment for LED TVs, 2009-2011 (cumulative sets)
Chart 24: MKE’s planned promotion of local supply of LED equipment
Table 5: Jusung Engineering expands from semiconductor to LCD and LED
Table 8: Overview of manufacturing techniques for sapphire ingots by manufacturer
Chart 26: Rubicon’s sapphire ingot capacity, 2009-2011 (kmm/month)
Chart 27: Overview of Rubicon’s production of 3, 30, 85 and 200kg class sapphire boules
Chart 29: STC sapphire ingot capacity, 2009-2011 (kmm/month)
Chart 30: Revenue comparison for Rubicon and STC, 2006-2010 (US$m)
Chart 31: Comparison of Rubicon and STC sapphire ingot capacity, 2Q10-4Q10 (kmm/month)
Table 12: MKE single-crystal sapphire materials for LED applications participants
Chart 33: Monocrystal sapphire ingot capacity, 2009-2011 (kmm/month)
Chart 34: Kyocera sapphire ingot capacity, 2009-2011 (kmm/month)
Chart 35: Namiki sapphire ingot capacity, 2009-2011 (kmm/month)
Chart 36: ACME Electronics sapphire ingot capacity, 4Q09-4Q10 (kmm/month)
Chart 37: ACME sapphire ingot capacity, 2009-2011 (kmm/month)
Chart 38: Astek LED sapphire ingot crystal growth equipment, 1Q10-1Q11 (sets)
Chart 39: Astek sapphire ingot capacity, 2009-2011 (kmm/month)
Chart 40: Worldwide sapphire ingot capacity by manufacturer, 2009-2011 (kmm/month)
Chart 41: Total capacity of the seven major manufacturers, 2010-2011 (kmm/month)
STC is projected to account for 23% of global ingot capacity in 2011
Chart 42: Individual manufacturers’ share of global sapphire ingot capacity, EOY 2009 (%)
Chart 43: Individual manufacturers’ share of global sapphire ingot capacity, EOY 2010 (%)
Chart 44: Share of 2011 global capacity by manufacturer’s target capacity targets (%)
Table 15: Major South Korea firms moving into LED upstream sapphire ingot production
Table 16: Hansol expansion from LCD backlight modules into LED sapphire ingot sector
Table 18: Biemt expansion from semiconductor equipment into LED sapphire ingot sector
Chart 46: Biemt monthly capacity plans for LED sapphire ingots, 4Q10-4Q11 (k units/month)
Chart 47: Location of China’s major sapphire ingot manufacturers
Chart 48: China’s major sapphire ingot manufacturers by region
GCL Photoelectric plans largest investment located in Eastern China
Table 19: Major sapphire ingot manufacturers in Eastern China (from north to south)
Qingdao iStarWafer sets sapphire substrate capacity target of 1.8 million units/year by 2013
GCL Photoelectric plans to complete first phase of LED sapphire investment in March 2011
Zhejiang Crystal-Optech’s production line for high-brightness LED sapphire ingots
Table 20: Major China-based sapphire ingot manufacturers in Southwest China region
SIC Group launches assault on LED upstream materials sector by acquiring Honeywell ingot factory
Crystaland plans to expand sapphire ingot capacity to 700k units per month
Table 21: Crystaland comparison with other major technologies
Chart 49: Crystaland sapphire ingot manufacturing processes and main customers
Table 22: Major sapphire ingot manufacturers in Northeastern and Northwestern China
Aurora has 40 sapphire crystal growth furnaces and is developing towards larger sizes
Phase one of Shenguang’s sapphire ingot investment plans will be completed in second quarter 2011
Chart 50: 2-inch sapphire substrate price trends, 2008-1H11 (US$)
Chart 53: Samsung LED 2010 revenues and share by application (KRWb)
Chart 54: Samsung LED chip capacity, 2009-2010 (m units/month)
Chart 55: Lighting applications as a share of Samsung LED revenues, 2009-2011
Chart 56: Samsung LED TV backlight module usage development, 2007-2011
Table24: Samsung LED global efforts to expand lighting application business
Chart 57: Samsung LED 2011 product line of LEDs for lighting applications
Chart 58: Samsung LED’s capital expenditure, 2010-2011 ( KRWb)
Chart 60: LG Innotek LED revenue breakdown by application, 1Q09-4Q10 (KRWb)
Chart 61: LG Innotek LED revenue share by application, 1Q09-4Q10
Chart 63: LG Innotek LED business as share of total revenues, 2006-2010 (KRWb)
Chart 64: LG Innotek LED chip capacity, 2009-2010 (m units/month)
Table 27: LED packaging lines of two largest Korea-based firms in China
Chart 65: LED lighting as a share of LG Innotek revenue, 2009-2011
Chart 66: LG Innotek LED business capital expenditure, 2010-2011 (KRWb)
Chart 68: Seoul Semiconductors revenues by application, 1Q09-4Q10 (KRWb)
Chart 69: Seoul Semiconductor revenue share by application, 1Q09-4Q10 (KRWb)
Chart 70: Seoul Semiconductor revenues by application, 2006-2011 (KRWb)
Chart 71: Seoul Semiconductor revenue share by application, 2006-2011
Chart 72: Seoul Semiconductor’s LED packaging capacity, 2009-2011 (m units/month)
Chart 74: Seoul Optodevice’s LED chip capacity, 2009-2010 (m units/month)
Chart 75: Seoul Semiconductor’s LED chip self-supply ratio, 2009-2011 (m units/month)
Chart 76: Seoul Optodevice’s revenues and operating profits, 2008-2011 (b KRW)
Chart 77: LED lighting as share of Seoul Semiconductor total revenues, 2009-2011
Chart 79: Nichia revenues by business section, 2008 to 1H10 (JPYb)
Chart 80: Share of Nichia revenue by business section, 2008 to 1H10
Chart 81: Nichia global revenues by region, 2008-1H10 (JPYb)
Chart 84: Evolution of the efficiency of Nichia’s white LEDs (lm/W)
Chart 85: Nichia development of high-power LEDs for lighting applications
Table 32: History of Nichia’s development of high-power blue LDs
Table 33: Overview of Nichia’s LED investment plans for 1H10
Chart 86: Nichia investment in LED equipment, 2008-2010 (JPYb)
Table 36: Supply chains of Japan’s three largest LED lighting manufacturers
Chart 91: Pan-Epistar Group total MOCVD equipment inventory (sets)
Chart 92: Epistar revenues and annual growth rates, 2006-2010 ( NT$m)
Table 38: Epistar, AOC and Everlight establish Evertop as a joint venture
Table 39: Epistar and Toyoda Gosei establish joint venture TE Opto
Table 41: Evertop and TE Opto LED TV supply chain ties to tier one manufacturers
Table 42: TE Opto in LED lighting supply chains of international tier one manufacturers
Table 43: Epistar and Delta joint venture Crystalrich Lighting to mass produce in 2012
Chart 94: Epistar set to increase proportion of revenues from LED lighting
Table 44: History of Lextar’s involvement in the LED industry
Chart 95: Lextar revenues and gross profit margins, 2009-2010 ( NT$m)
Chart 96: Revenues of Lextar and other major Taiwan and South Korea makers, 2009-2010 (US$m)
Chart 98: 2-inch and 4-inch MOCVD equipment as a proportion of Lextar inventory
Chart 103: Comparison of Sanan revenues with major Taiwan LED chip manufacturers, 2009-2010 (US$m)
Chart 107: Sanan MOCVD equipment by factory, 2008-2009 (sets)
Chart 108: Sanan MOCVD equipment inventory by factory, 2011 (sets)
Chart 115: EpiValley registered LED patents by geographic region, end-2010
