
China's 12th Five Year Plan (12th FYP) for the 2011-2015 period is intended to address issues of both economic growth and energy consumption. Among the seven new key industries listed in the 12th FYP are "energy saving and environmental protection" and "new materials," both of which are closely connected with the LED industry. While China's LED industry in China is still in its initial phase of development, the considerable boost promised by the 12th FYP will ensure that the industry plays a major role in both GDP growth and reducing energy consumption.
The China LED industry is currently somewhat bottom-heavy in structural terms, with a large downstream sector matched with only a small upstream industry. This means that despite the fact that China-based firms lag behind Taiwan-based firms and the major international players in upstream sectors such as LED epitaxy technology, the potential for future growth remains enormous. The effect of the 12th FYP and associated subsidy policies is projected to lead to healthier and more comprehensive development throughout the entire LED industry in China.
The 12th FYP will also leverage China's considerable advantage in rare earth materials to promote the development of the LED phosphor sector in China. Following China's imposition of limits on rare earth exports and the quarter-on-quarter increase in the price of such materials, the issue of whether China opts to use rare earth materials as a strategic commodity to pursue technical partnerships with foreign companies will be one of the developments that is most worthy of close attention.
Table 1: Major industries for development under China's 12th FYP
Chart 1: China's GDP and energy consumption per unit of GDP, 2005-2011 (b CNY, TCE/10k CNY)
Chart 2: GDP and energy consumption per unit of GDP, 2010-2020 (b CNY, TCE/10k CNY)
China's 12th Five Year Plan for the LED industry and associated policies
Table 2: China's national solid-state lighting (SSL) plans and policies
Table 3: Core issues for solid-state lighting (SSL) in China's 12th FYP
Chart 5: Phases of development for key applications of LED lighting in China, 2000-2020
Table 4: Support institutions for the China's LED R&D, market development and sales sectors
Key areas for economic development within the 12th Five Year Plan for the LED industry
Chart 8: The seven strategic new industries' share of GDP will grow to 15% by 2020
Chart 9: Employment in primary, secondary and tertiary industry in China, 2009
Chart 11: The output value of China's LED industry, 2008-2015 (b CNY)
Goals and key points for the LED industry in China's 12th Five Year Plan
Chart 13: Development goals for the LED industry in the 12th FYP: "self-supply" and "concentration"
Chart 14: Comparison of LED lighting industry policy in China, Japan and South Korea
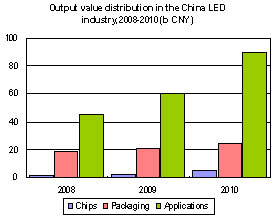
Chart 15: Output value distribution in the China LED industry, 2008-2010 (b CNY)
Chart 16: Share of output value in the China LED industry by sector, 2008-2010
Chart 17: Output value annual growth rates by sector for the China LED industry, 2008-2010
Chart 18: Number of upstream and downstream LED firms in China by sector, 1H11
Chart 20: China-based SMD package manufacturers by capacity (KK/month, no. firms)
Chart 21: 2015 self-sufficiency rate targets for the China LED industry by sector
Chart 22: Luminous efficacy of LED chips and future targets, 2007-2015 (lm/W)
Pearl River Delta is the largest package market for SSL in China and a focal point for investment
SSL industries of Xi'an and Wuhan are small but their potential should not be overlooked
Chart 24: Main China national and industry standards for LED lighting
Chart 25: Provisions of China's major national and industry standards for LED lighting
Chart 26: China's national and local standards for LED streetlights
Chart 27: China and Japan's standing in the global industry in terms of LED-related patents
Chart 28: China's global standing in LED chip patents in comparison to other countries/regions
Chart 29: China's LED patents are highly concentrated in the coastal regions
Taiwan-based companies are the largest group of foreign firms applying for LED patents in China
Chart 30: Breakdown of China LED patent applications by firms from other regions/countries
China to focus on LED chip patent applications during 12th FYP
Table 10: Projected patent application items for China during the 12th FYP period
Chart 31: China MOCVD equipment purchase subsidies have stimulated investment
Table 11: Major local government usage of MOCVD equipment subsidies
Table 12: Number of MOCVD systems added by major China-based chip manufacturers in 2011
Chart 34: Electech MOCVD system expansion activities in Anhui Province, 2011
Yangzhou's generous MOCVD subsidies help the city to attract a number of LED chip manufacturers
Table 13: Major LED chip manufacturers' MOCVD system expansion activities in Jiangsu Province, 2011
Table 15: Taiwan-based LED chip makers' China investment plans
Table 16: Comparison of different LED substrate technologies and related focus of China's 12th FYP
Table 17: Subsidies for sapphire and silicon substrates in the 12th FYP's 863 Plan
Table 18: Subsidies for silicon carbide substrates in the 12th FYP's 863 Plan
Table 19: Production and capacity plans of sapphire ingot manufacturers in East China
Chart 37: Distribution of China's rare earth resources and their global significance
Table 21: Development of China's rare earth policies, 2007-2015
Chart 38: Major rare earth development policies in China's 12th FYP
Table 22: Main application sectors for rare earth light-emitting materials
Chart 40: Rare earth elements are vital materials for LED lighting phosphors
Chart 41: China's export quotas for rare earth materials, 2009-2011 (t)
Chart 42: Prices of rare earth materials used in LED phosphors, January-June 2011 (US$)
Chart 43: Major China manufacturers of rare earth phosphors and their development plans
Chart 45: 2015 LED application market distribution targets in the 12th FYP
Chart 46: Key energy saving projects and targets in the 12th FYP
Chart 47: Implementation methods and examples of energy saving product public welfare projects
Chart 48: China's flat panel TV energy efficiency limits and efficiency ratings
Chart 49: China LED TV shipments and penetration rates, 2009-2013 (k units)
Chart 50: China's changing LED streetlight market, 2009-2013 (k lamps)
Chart 51: China LED tunnel lighting market, 2009-2013 (k units)
