CONNECT WITH US

Global AP demand forecast, 2017-2020

Staff writer
Staff writer
Digitimes Research expects global application processor (AP) shipments to increase more than 8% in 2017 and surpass the 1.9 billion mark, with smartphones remaining the main application. After slumping in 2015, Qualcomm returned to form in 2016 and will continue leading the market in 2017, as other players continue playing catch up and scramble for funds to invest in more diverse applications such as IoT and other smart end-device applications.
Abstract
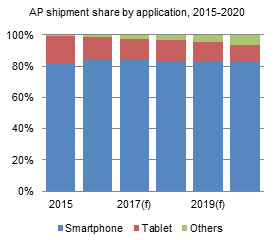
AP shipment share by application, 2015-2020

Digitimes Research expects global application processor (AP) shipments to increase more than 8% in 2017 and surpass the 1.9 billion mark, with smartphones remaining the main application. After slumping in 2015, Qualcomm returned to form in 2016 and will continue leading the market in 2017, as other players continue playing catch up and scramble for funds to invest in more diverse applications such as IoT and other smart end-device applications.

Table of contents
  • Introduction

  • Chart 1: Global AP shipments, 2015-2020 (b units)

  • Shipment breakdown

  • By application

  • Chart 2: Shipments by application, 2015-2020 (m units)

  • Chart 3: Shipment share by application, 2015-2020

  • By supplier

  • Chart 4: Shipments by supplier, 2015-2020 (m units)

  • Chart 5: Shipment share by supplier, 2015-2020

  • By manufacturing process

  • Chart 6: Shipments by manufacturing process, 2015-2020 (m units)

  • Chart 7: Shipment share by manufacturing process, 2015-2020

  • By baseband technology

  • Chart 8: Shipments by baseband technology, 2015-2020 (m units)

  • Chart 9: Shipment share by baseband technology, 2015-2020

  • Top-5 AP suppliers

  • Qualcomm

  • Chart 10: Qualcomm AP shipments, 2015-2020 (m units)

  • Chart 11: Qualcomm shipments by application, 2015-2020 (m units)

  • Chart 12: Qualcomm shipment share by application, 2015-2020

  • Chart 13: Qualcomm shipment share by product series, 2015-2017

  • MediaTek

  • Chart 14: MediaTek AP shipments, 2015-2020 (m units)

  • Chart 15: MediaTek shipments by application, 2015-2020 (m units)

  • Chart 16: MediaTek shipment share by application, 2015-2020

  • Chart 17: MediaTek shipment share by product series, 2015-2017

  • Apple

  • Chart 18: Apple AP shipments, 2015-2020 (m units)

  • Chart 19: Apple shipments by application, 2015-2020 (m units)

  • Chart 20: Apple shipment share by application, 2015-2020

  • Spreadtrum

  • Chart 21: Spreadtrum AP shipments, 2015-2020 (m units)

  • Chart 22: Spreadtrum shipments by application, 2015-2020 (m units)

  • Chart 23: Spreadtrum shipment share by application, 2015-2020

  • Chart 24: Spreadtrum shipment share by market, 2015-2017

  • Samsung

  • Chart 25: Samsung AP shipments, 2015-2020 (m units)

  • Chart 26: Samsung shipments by application, 2015-2020 (m units)

  • Chart 27: Samsung shipment share by application, 2015-2020

  • Chart 28: Samsung shipment share by product series, 2015-2017

  • Embedded GPUs

  • Chart 29: Embedded GPU shipments by vendor, 2015-2017 (m units)

  • Chart 30: Embedded GPU share by vendor, 2015-2017

  • TABLES AND CHARTS

    Download Full Report (subscription required)

    Published: January 16, 2017

    Pick an option that is right for you

    Single Report
    • US$1,000
    Team or Enterprise Subscription
    Inquire
    Have a Question?
    consultant
    Customized Market Research Services
    We can customize the research to meet your specific needs, helping you make strategic and profitable business decisions.
    Sample Reports
    Connect with a Consultant