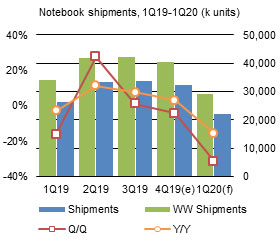
Global notebook unit shipments for the first quarter of 2020 are estimated to experience a sharp sequential fall of 29-36% than the 17% projected earlier, as severe labor and components shortages and stagnant logistics arising from the coronavirus outbreak are derailing the supply chain in China, which commands over 90% of global notebook production.
Global smartphone shipments are expected to slip below 1.3 billion units in 2020, including less than 200 million units of 5G models, taking into account the impacts of the outbreak on China and around the world in terms of economic growth.
Among IT product supply chains, the tablet sector has experienced less impact from the epidemic as most tablet factories had remained in production during the Lunar New Year holiday, while those located in regions less affected by the virus have begun resuming production since February 10. In general, the tablet sector is witnessing better capacity recovery than the notebook and smartphone sectors.
Chart 5: Global shipments by major vendor, 4Q18-1Q20 (k units)
Table 1: Key factors affecting 1Q20 notebook shipments by coronavirus outbreak
Table 2: ODM capacity recovery timeline and components supply status
Chart 16: Taiwan and global notebook shipments, 2015-2019 (k units)
Chart 18: Global shipments by major vendor, 2016-2019 (k units)
Table 4: Key supply factors affecting 1Q20 smartphone shipments in China
Table 5: Key supply factors affecting 1Q20 smartphone shipments in China (part 2)
Table 6: Key demand factors affecting 1Q20 smartphone shipments in China
Chart 19: China top-4 smartphone brand shipment estimates, 1Q20 (m units)
Chart 20: Global smartphone shipment estimates, 2020 (m units)
Chart 21: China and global 5G smartphone shipment estimates, 2020 (m units)
Chart 22: China and global 5G smartphone penetration rate estimates, 2020
Table 7: Key factors affecting tablet shipments, 1Q20 (Brand)
Chart 24: Shipments by product - iPad, non-iPad branded and white-box, 4Q18-1Q20 (m units)
Chart 25: Shipment share by product - iPad, non-iPad branded and white-box, 4Q18-1Q20
Chart 30: Shipments by touchscreen technology, 4Q18-1Q20 (m units)
Chart 31: Shipment share by touchscreen technology, 4Q18-1Q20
Chart 36: Detachable notebook shipments, 4Q18-1Q20 (k units)
Chart 37: Shipments of detachable notebooks by OS, 4Q18-1Q20 (k units)
Chart 38: Shipments from Taiwan makers and share of global shipments, 4Q18-1Q20 (m units)
Chart 39: Taiwan tablet shipments by maker, 4Q18-1Q20 (m units)

