CONNECT WITH US

Trends in the global IC design service market

Staff writer
Staff writer
With the cost of developing a new semiconductor fab anticipated to surpass US$5.0 billion by 2015, more and more IDMs are adopting a fab-lite outsourcing model. The growth in the merchant foundry industry has also provided fabless IC design firms with access to reasonably-priced advanced-process capacity without the need for huge capital expenditure, and IC design has therefore grown as a share of the semiconductor market to 25.8%, up from less than 10% in 2000. This Digitimes Special report focuses on how the foundry sector supports IC design customers through design services and trends among the key industry design platforms.
Abstract
Comparison of IC costs with the evolution of process node

With the cost of developing a new semiconductor fab anticipated to surpass US$5.0 billion by 2015, more and more IDMs are adopting a fab-lite outsourcing model. The growth in the merchant foundry industry has also provided fabless IC design firms with access to reasonably-priced advanced-process capacity without the need for huge capital expenditure, and IC design has therefore grown as a share of the semiconductor market to 25.8%, up from less than 10% in 2000.

This Digitimes Special report focuses on how the foundry sector supports IC design customers through design services and trends among the key industry design platforms.

Table of contents
  • Global trends in IC design technology

  • IC design project costs

  • Cost structure

  • Chart 1: Cost structure of IC design projects by process node (US$m)

  • Cost analysis

  • Chart 2: IC design is becoming increasingly complex

  • Chart 3: Photomask costs have increased massively for advanced processes (US$m)

  • Chart 4: Embedded software support for multiple platforms is already a necessity

  • Chart 5: Turnkey services help to ensure chip yield

  • Development of IC design technologies

  • Trends in the number of IC design projects

  • Chart 6: Comparison of IC design project numbers with the evolution of process nodes

  • Trends in IC design technology

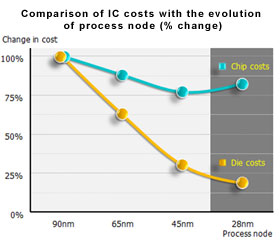
  • Chart 7: Comparison of IC costs with the evolution of process node (% change)

  • Chart 8: Design concepts of Apple's A4 processor architecture

  • Chart 9: Affect of time to market on IC project profits

  • Chart 10: Collaborative development effectively shortens the development process for devices

  • Next generation IC design industry ecosystem

  • Chart 11: Next generation IC design industry ecosystem

  • Outlook for global IC design services market

  • Analysis of semiconductor companies' outsourcing strategies

  • Stage 1: Package testing

  • Stage 2: Wafer manufacturing

  • Stage 3: IC design

  • Chart 12: Thinking behind the different stages of IDM outsourcing and associated potential opportunities for the semiconductor industry

  • Global trends towards the lightening of IDM assets

  • Chart 13: Semiconductor process technology versus factory construction costs (US$b)

  • Timeline of asset-lightening for global IDMs

  • Chart 14: Date of announcement of global IDM's asset-lighting strategies

  • Status quo in the global IC design service market

  • Chart 15: Overall effective market size and structural distribution in the IC design service sector, 2007-2011 (US$b)

  • Outlook for global IC design services market

  • Popularity of fabless business models continues to increase

  • Chart 16: IC design output value and share of the semiconductor market, 2007-2011 (US$b)

  • Fab-lite strategies as major industry trend

  • Chart 17: Output value and share of the semiconductor market for the merchant foundry industry, 2007-2011 (US$b)

  • Outlook for the global IC design services market

  • Chart 18: Overall effective market size and structural distribution in the IC design service sector, 2011-2015 (US$b)

  • Taiwan IC design service industry

  • Scope of the IC design service industry

  • Chart 19: Scope of the IC design service industry

  • Trends in the Taiwan IC design service industry

  • Operational characteristics

  • Chart 20: Merchant foundries' strategies for client selection and resource allocation

  • Size of the industry

  • Chart 21: Taiwan IC design service industry value and growth, 2007-2011 (NT$b)

  • Growth trends

  • Chart 22: Comparison of growth trends in the Taiwan IC design service industry and the global IC industry, 2007-2011

  • Revenue structures in the Taiwan IC design service industry

  • Products

  • Chart 23: Share of Taiwan IC design service industry by product sectors, 2011

  • Application sectors

  • Chart 24: Share of Taiwan IC design service industry by application sector, 2011

  • Sales regions

  • Chart 25: Share of Taiwan IC design service industry by sales region, 2011

  • Process technology

  • Chart 26: Share of Taiwan IC design service industry by process technology, 2011

  • Status quo for Taiwan IC design service firms

  • Taiwan IC design service industry chain

  • Chart 27: Taiwan IC design industry chain and associated companies

  • Breakdown of revenues for Taiwan IC design service companies

  • Chart 28: Revenue share among companies in the Taiwan IC design service industry

  • Taiwan IC design service companies

  • Taiwan IC design service companies' process platforms

  • Process platforms of the major global foundry companies

  • Chart 29: Process platforms of the major global merchant foundries

  • Process platforms of Taiwan's IC design service companies

  • Chart 30: Platform processes of Taiwan's major IC design service firms

  • Revenue distribution for the process platforms of Taiwan-based IC design service providers

  • Chart 31: Process platform share in the Taiwan IC design service industry, 2011

  • TSMC process platform companies

  • Global Unichip

  • Chart 32: Evolution of Global Unichip's process technology and manufacturing service suppliers

  • Chart 33: Global Unichip revenues, 2007-2011 (NT$b)

  • Chart 34: Global Unichip's 2011 revenue share by product

  • Chart 35: Global Unichip's 2011 revenue share by application sector

  • Chart 36: Global Unichip's 2011 revenue share by sales region

  • Chart 37: Global Unichip's 2011 revenue share by process technology

  • Alchip Technologies

  • Chart 38: Evolution of Alchip's process technology and manufacturing service suppliers

  • Chart 39: Alchip revenues, 2007-2011 (NT$b)

  • Chart 40: Alchip's 2011 revenue share by product

  • Chart 41: Alchip's 2011 revenue share by application sector

  • Chart 42: Alchip's 2011 revenue share by sales region

  • Chart 43: Alchip's 2011 revenue share by process technology

  • Progate (Prograte Group Corporation, PGC)

  • Chart 44: Evolution of Progate's process technology and manufacturing service suppliers

  • Chart 45: Progate's revenues, 2007-2011 (NT$b)

  • Goyatek

  • Chart 46: Overview of Goyatek's history and manufacturing service suppliers

  • Chart 47: Goyatek's revenues, 2007-2011 (NT$b)

  • Companies on the UMC process platform

  • Chart 48: Evolution of Faraday's process technology and manufacturing service suppliers

  • Chart 49: Faraday's revenues, 2007-2011 (NT$b)

  • Chart 50: Faraday's 2011 revenue share by product

  • Chart 51: Faraday's 2011 revenue share by application sector

  • Chart 52: Faraday's 2011 revenue share by sales region

  • Chart 53: Faraday's 2011 revenue share by process technology

  • The Common Platform process platform

  • Socle

  • Chart 54: Overview of Socle's history and manufacturing service suppliers

  • Chart 55: Share of 12-inch wafer capacity among foundries on the Common Platform, 2011

  • CoAsia

  • Chart 56: CoAsia's main operations and manufacturing service suppliers

  • Chart 57: IC design services as share of CoAsia's revenues, 2007-2011 (NT$b)

  • Outlook for Taiwan IC design service companies

  • Trends in the global IC design service industry

  • Chart 58: Comparison of the evolution of process technology for foundries and IC design services

  • Trends in the Taiwan IC design service industry

  • 28nm design projects and 40nm manufacturing services will be the main growth drivers in 2012

  • Chart 59: Timetable for process technology development and mass production for the Taiwan IC design service industry

  • Trend toward mergers and consolidation continues

  • Chart 60: Comparison of the evolution of process technology and the number of design projects

  • Operational outlook for IC design service firms in Taiwan

  • Chart 61: Global share of merchant foundry 12-inch capacity by platform, 2011

  • UMC process platform

  • Common Platform process platform

  • Chart 62: Process platforms in the Taiwan IC design service industry

  • TABLES AND CHARTS

    Download Full Report (subscription required)

    Published: March 13, 2012

    Pick an option that is right for you

    Team or Enterprise Subscription
    Inquire
    Have a Question?
    consultant
    Customized Market Research Services
    We can customize the research to meet your specific needs, helping you make strategic and profitable business decisions.
    Sample Reports
    Connect with a Consultant