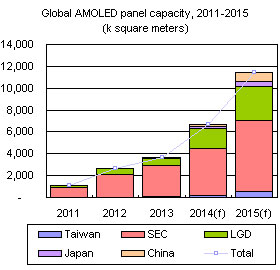
The thin, light structure and high image quality of AMOLED panels has led many to regard them as the display technology of the future. South Korean manufacturers currently have more than 95% of the large and small/medium AMOLED panel markets, but display panel manufacturers in China, Taiwan and Japan have by no means abandoned their efforts to compete in these sectors.
This report analyzes the current state of development and strategies of the two largest AMOLED panel makers, Samsung Electronics and LG Display, examines the potential of the AMOLED handset panel and OLED TV markets, and takes an in-depth look at the competitiveness of South Korea in the AMOLED sector and the reasons behind it, including brand strength and supply chain integration.
The AMOLED market still faces a number of challenges, particularly from full HD and higher resolution small LCD panels and UHD LED TV panels, threats which could push back AMOLED's adoption as the next generation of mainstream display technology. In addition, Digitimes Research analyzes the potential future positions and opportunities for panel manufacturers in China, Taiwan and Japan in the AMOLED market.
Chart 1: Samsung display-related capital expenditure by application, 2009-2013 (KRWt)
Chart 2: Samsung Display AMOLED panel capacity (k square meters)
Chart 3: Samsung Display AMOLED capacity by application (k square meters)
Chart 4: LG Display capital expenditure by application, 2009-2013 (KRWt)
Chart 6: Global AMOLED panel capacity, 2011-2015 (k square meters)
Chart 7: Breakdown of global AMOLED capacity share, 2011-2015
Chart 8: Global AMOLED capacity by application (large, small/medium), 2011-2015 (k square meters)
Chart 10: Revenues for Samsung's small/medium panel businesses, including TFT LCD and OLED, (KRWt)
Chart 11: Proportion of Samsung smartphone shipments using AMOLED panels, 2012-2015 (Units million)
Chart 12: LG Electronics was the first to launch a commercial large curved-screen OLED TV
Chart 13: Production yield projections for 40-inch and larger OLED TV panels, 2012-2015
Chart 15: Global shipment forecasts for UHD LCD TV panel suppliers in 2013 (K units)
Chart 16: UHD LCD TV panel maker's share of global shipments, 2013
Chart 18: Wearable devices are a potential opportunity for developing flexible AMOLED panels
AMOLED panel shipments for the major application sectors, 2011-2015
Chart 19: Global AMOLED panel shipments by application, 2011-2015 (M units)
Chart 20: Panel sizes and prices for panels used in major smartphone models (US$)
Chart 21: Global average shipment unit prices for AMOLED panels by application, 2011-2015 (US$)
AMOLED panel shipment value for the major application sectors, 2011-2015
Chart 22: Global AMOLED shipment value by application, 2011-2015(US$m)
Chart 23: Share of global AMOLED panel shipment value for various application sectors, 2011-2015
Trends in the South Korean AMOLED materials and equipment industries
Chart 26: PHOLED can significantly reduce the power consumption of OLEDs (Unit: mW)
Chart 27: Comparison of fluorescent and phosphorescent materials for AMOLED
Chart 30: Samsung Display major South Korean equipment suppliers catagorized by AMOLED process
Chart 32: AP Systems' revenues and operating profit margin rates, 2010-2013
Chart 34: LG Display major equipment companies categorized by AMOLED process
Chart 35: Details of OLED TVs and panesls introduced in 2013
Chart 36: Tablet displays surpass 300ppi in 2013 and will surpass 400ppi in 2014
Chart 37: Size and pixel density targets for Japan Display OLED panels
Chart 38: Production timetable for Tianma's 5.5G LTPS TFT/AMOLED factories

