This report examines the outlook for upstream, midstream and downstream sectors of the LED industry in 2013. The upstream sector, which includes MOCVD equipment, rare earth materials and sapphire substrates, is also particularly significant as an indicator of trends in the LED industry as a whole over the next year. As Taiwan's LED chip manufacturers are the global number one in terms of capacity, this report provides operational forecasts, product line makeup and capacity information for Taiwan-based LED chip makers in the second half of 2013, as well as analyses and key data for their major competitors in the Asia region. The section on downstream demand focuses on products that are exhibiting marked growth in 2013, including low-priced, direct-lit LED TVs and LED light bulbs. There is also an analysis of trends in LED light bulb specifications and prices for the second half of 2013.
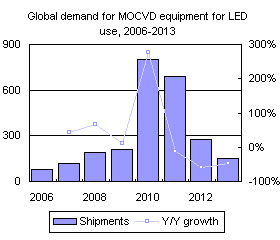
Chart 1: Global demand for MOCVD equipment for LED use, 2006-2013
Chart 2: MOCVD business revenues as a share of total 2013 revenues for Veeco and Aixtron (US$m)
Chart 4: Regional breakdown share of MOCVD demand, 2012-2013
Chart 5: China's rare earth export quotas and actual exports, 2009-2013 (tons)
Chart 6: Breakdown share of China's rare earth export quota by rare earth type, 2012-2013
Chart 7: Share of China's rare earth export quota by company, 2012 quotas
Chart 8: Share of China's rare earth export quota by company, first-batch quotas of 2013
Chart 9: Major destination, share by region, for China's rare earth exports in 2012
Chart 10: Rare earth material price trends, January 2012 to May 2013 (US$/kg)
Chart 11: Two-inch sapphire substrate prices, 1Q11-4Q13 (US$)
Chart 12: Rubicon and STC's total revenues, 2008-2013 (US$m)
Chart 13: Major crystal manufacturing companies' share of the global sapphire market in 2013
Chart 14: Capacity comparison for the major global sapphire manufacturers in 2013 (Kmm/month)
Analysis of global high-brightness LED shipments by application
Chart 15: Global high-brightness LED shipment share by application sector, 2009-2013
Table 4: Key data for direct-lit LED TVs and backlighting in 2013
Chart 16: Low-priced direct-lit LED TVs' share of shipments for TV makers in each region, 2013
Chart 17: Shipments for LCD TVs by maker/region, 2013 (m units)
Chart 19: Shipments of low-priced direct-lit LED TVs by maker/region, 2013 (m units)
Analysis of low-priced direct-lit LED TV market share in 2013
Chart 20: Low-priced direct-lit LED TVs shipment share by maker/region, 2013
Chart 21: Direct-lit LED TVs' share of overall LCD TV shipments, 2013
Chart 22: Direct-lit LED TVs global shipment share and penetration rate, 1H13-2H13 (m units)
Chart 25: Low-priced direct-lit LED TV share of LED TV shipments by maker/region, 1H13-2H13
LED TV backlight shipments for low-priced direct-lit LED TVs in 2013
Chart 27: Breakdown share of LED chips used for low-priced direct-lit LED TVs by screen size, 2013
Analysis of LED light bulb shipments for second half of 2013 by wattage
Table 6: Equivalent specifications for incandescent, energy-saving and LED light bulbs
Chart 30: Share of LED light bulb shipments by 40W, 60W and 75W products, 2012-2013
Analysis of LED light bulb shipments for the second half of 2013 by light distribution angle
Chart 31: LED light bulb shipment share by light distribution angle, 2012-2013
Analysis of LED light bulb shipments for the second half of 2013 by luminous efficacy
Chart 32: LED light bulb shipment share by luminous efficacy, 2012-2013 (lm/W)
Chart 33: Light bulb sales in Japan by lighting type, 2009-2013 (m units)
Chart 34: Light bulb sales share in Japan by type of bulb, 2009-2013
Chart 35: Global distribution of light bulb-type light sockets by region
Chart 36: Global LED light bulb shipments, 2011-2013 (m units)
Table 7: Global LED tube light shipments and penetration rate for 2013
Chart 37: Cost structure share by component for 4-foot T8 LED tube lights
Chart 38: Price trends for 4-foot T8 LED tube lights, 2011-2013 (US$)
Global comparison of mainstream specifications for LED tube lights
Table 8: Comparison of LED tube light specifications and the major camps
Chart 39: Global LED tube light shipments and penetration rates, 2013 (m units)
Supply and demand for Taiwan-based firms' LED shipments in the second half of 2013
Table 9: Factors affecting Taiwan-based firms' LED shipments in 2H13
Outlook for the Taiwan LED industry in the second half of 2013
Chart 41: Taiwan-based LED chip maker revenues, 1Q12-4Q13 (NT$m)
Chart 43: Industry concentration level for the Taiwan LED chip industry
Revenue share forecasts by application sector for Taiwan-based LED chip makers
Chart 44: Breakdown of Taiwan-based LED chip makers' revenues by application sector, 1H13 and 2H13
Chart 45: Taiwan-based LED chip makers revenues by application sector, 1H13 and 2H13 (NT$m)
Chart 46: Taiwan-based LED chip makers' revenues by application sector, 2012-2013 (NT$m)
Chart 47: Breakdown of Taiwan-based LED chip makers' revenues by application sector, 2012-2013
Operational analysis for LED chip makers in Asia during 2013
Chart 48: Revenues for the LED business units of chip makers in the Asia region, 2011-2013 (US$m)
Chart 49: Number of MOCVD units for the major LED manufacturers in in each region in 2013
LED chip product distribution analysis for the Asia region in 2013
Chart 50: Comparing product distribution in 2013 for Asian LED chip makers, Taiwan vs. South Korea
Chart 51: Revenues by product type for South Korea's big 3 LED chip makers, 2013 (KRWb)
Chart 52: Revenue distribution by product type for South Korea's big 3 LED chip makers, 2013
Chart 53: Comparing product distribution in 2013 for Asian LED chip makers, Taiwan vs. Japan
Chart 54: Nichia's investment in equipment and factories, 2008-2013 (JPYb)
Chart 55: Revenues for Toyoda Gosei's optoelectronics division, 2008-2013 financial years (JPYb)
Table 11: Comparing operations for Asian LED chip makers in 2013, Taiwan vs. China

