CONNECT WITH US

Trends and forecasts for the China FPD industry, 2014-2017

Tony Huang
Tony Huang
With China being the world's IT production center and a country with some of the strongest consumer demand, along with benefits on custom tax, funding, loans, and subsidies provided by the government, China's FPD industry continues to show strong growth. Local firms such as BOE, CSOT, Tianma Microelectronics, and CEC Panda have been aggressive in developing 6G and above LCD panel production lines. This Digitimes Research Special Report analyzes the current FPD players in China and forecast how China's industry will progress through 2017.
Abstract
China FPD makers: Revenues and global share, 2012-2017 (US$m)

With China being the world's IT production center and a country with some of the strongest consumer demand, along with benefits on custom tax, funding, loans, and subsidies provided by the government, China's FPD industry continues to show strong growth. Local firms such as BOE, CSOT, Tianma Microelectronics, and CEC Panda have been aggressive in developing 6G and above LCD panel production lines. This Digitimes Research Special Report analyzes the current FPD players in China and forecast how China's industry will progress through 2017.

Table of contents
  • China FPD industrial policy

  • Chart 1: Products imported by China, 2013 (CNYb)

  • Chart 2: China exports and imports, 2007-1H14 (CNYb)

  • Chart 3: China flat panel industry milestones

  • China's LCD self-sufficiency ratio target

  • Chart 4: China LCD self-sufficiency rate by application, 2012-2013

  • Competitive edge for China local FPD makers

  • Chart 5: China TV exports, 1Q13-2Q14 (m units)

  • BOE Optoelectronics (BOE)

  • Capacity expansion and global share, 2011-2017

  • Table 1: BOE panel production overview (1/2)

  • Table 2: BOE panel production overview (2/2)

  • Chart 6: BOE panel capacity 2011-2017 (km2)

  • Chart 7: BOE global panel capacity share, 2011-2017

  • BOE's financial operations, 2010-1H14

  • Chart 8: BOE financials, 2010-1H14, (CNYm)

  • Chart 9: BOE, TCL and Tianma operating income, 2011-2014, (CNYm)

  • BOE major customers

  • Chart 10: BOE revenues from major customers, 2010-2014, (CNYm)

  • Table 3: BOE major customers by panel applications

  • BOE's strategy to catch up with major LCD makers

  • Table 4: BOE fund-raising activities, (CNYb)

  • BOE competitive edge analysis

  • Chart 11: BOE advantage

  • BOE LCD panel shipments by application

  • Chart 12: BOE panel shipments by application, 2012-2017, (k units)

  • BOE display panel revenue forecast, 2011-2017

  • Chart 13: BOE panel production revenues, 2013-2017 (CNYm)

  • China Star (CSOT)

  • Chart 14: CSOT LCD TV panel capacity and global share, 2011-2017 (km2)

  • CSOT revenues and operating profit 2012-1H'14

  • Chart 15: CSOT financials, 2012-2014 (CNYm)

  • Comparison with other makers

  • Chart 16: Major China LCD makers' operating income, 2011-2013, (CNYm)

  • Chart 17: Major LCD makers' non-current liabilities, 2011-2013 (CNYm)

  • CSOT major customers

  • Chart 18: CSOT LCD panel shipments by customer, 2014

  • CSOT strategy to catch up with major LCD makers

  • CSOT's competitive analysis

  • Chart 19: CSOT competitive advantage

  • Chart 20: TCL LCD TV shipments, including brand and OEM, 2010-2015 (k units)

  • Chart 21: China UHD LCD TV panel demand, 2013-2017, (m units)

  • CSOT LCD panel shipments forecast, 2011-2017

  • Chart 22: CSOT TV panel shipments, 2012-2017 (k units)

  • CSOT S&M LCD/AMOLED panel development

  • Chart 23: CSOT Wuhan joint venture 6G fab source of investment funds

  • China's other FPD makers

  • CEC Panda Display

  • Chart 24: CEC Panda panel shipment, by application, 2013-2017 (K units)

  • Tianma Microelectronics (Tianma)

  • Chart 25: Tianma revenues and profit, 2013-2014 (CNYm)

  • Chart 26: Tianma customer breakdown, by share of sales

  • Chart 27: Tianma top-5 customers and share of shipments, 2014

  • Chart 28: Tianma subsidiaries financials, 2014 (CNYm)

  • Chart 29: Tianma LCD shipments by application, 2013-2017 (k units)

  • IVO

  • Chart 30: IVO LCD panel shipments by application, 2013-2017 (k untis)

  • Others

  • China's FPD industry forecast 2014-2017

  • Chart 31: China LCD capacity, 2011-2017, (Km2/Year)

  • China LCD capacity growth, 2011-2017

  • Chart 32: Global share of China LCD makers, 2012-2017 (Km2/year)

  • Chart 33: Global share of China-based LCD capacity, 2011-2017

  • China large-size LCD panel shipment forecast through 2017

  • Chart 34: China large-size LCD panel shipments, 2012-2017 (K units)

  • Global share of China large-size LCD shipments through 2017

  • Chart 35: Local China large-size LCD panel shipments, 2013-2017 (K units)

  • China S&M LCD panel shipment forecast through 2017

  • Chart 36: Mainland China S&M panel shipments by application, 2012-2017 (K units)

  • LCD panel revenue forecast through 2017

  • Chart 37: China FPD revenues by maker, 2012-2017 (CNYm)

  • Chart 38: China FPD revenue share by maker, 2012-2017

  • Analysis of China's rush to the AMOLED market

  • Table 5: China AMOLED production line developments

  • Conclusion

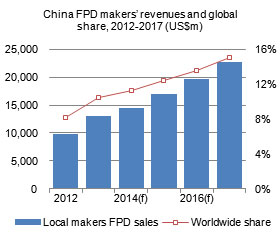
  • Chart 39: Mainland China FPD makers' revenues and global share, 2012-2017 (US$m)

  • TABLES AND CHARTS

    Download Full Report (subscription required)

    Published: October 6, 2014

    Pick an option that is right for you

    Team or Enterprise Subscription
    Inquire
    Have a Question?
    consultant
    Customized Market Research Services
    We can customize the research to meet your specific needs, helping you make strategic and profitable business decisions.
    Sample Reports
    Connect with a Consultant