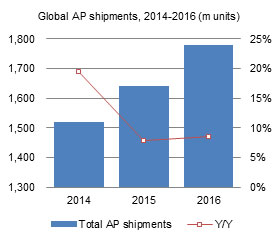
This Digitimes Research Special Report explains the dynamics of the global AP market by analyzing key trends in the market including the shift to 4G, the market strategy of the key AP vendors and GPU providers and the role various applications have in influencing demand. Overall, Digitimes Research forecasts that the global application processor market will grow 8.5% in 2016 to reach 1.78 billion shipments.
Chart 3: 4G penetration in China driving global 4G application development.
Chart 4: Baseband shipment share by vendor and communication technology, 2014-2015
Chart 5: AP shipment share by vendor and communication technology, 2015-2016
Chart 14: AP vendor share for Samsung end devices, 2015-2016
Chart 15: Samsung and Apple AP shipments, 2014-2016 (m units)
Chart 17: Samsung AP shipment share by device type, 2015-2016
Chart 18: Intel AP shipment share by architecture, 2014-2016
Chart 19: Intel SoFIA AP shipment share by product, 2015-2016
Chart 20: Intel smartphone AP s shipment share by architecture, 2015
Chart 21: Intel tablet AP shipment share by architecture, 2015
Chart 22: Intel AP shipments by mobile platform, 2014-2016 (m units)
Chart 23: MediaTek AP shipments by mobile platform, 2014-2016 (m units)
Chart 24: MediaTek shipment share by architecture, 2014-2016
Chart 26: MediaTek Helio X20 shipment share by customer, 2015-2016
Chart 27: MediaTek AP shipment share by communication technology, 2014-2016
Chart 29: Qualcomm quarterly revenue and net profit, Fiscal 2015 (US$b)
Chart 31: Qualcomm's mid-range processors to feature high-performing architecture in 2016
Chart 32: Qualcomm AP shipments by mobile application, 2014-2016 (m units)
Chart 34: Spreadtrum smartphone AP shipment share by communication technology, 2014-2015
Chart 37: Spreadtrum shipments to China and rest of world, 2014-2016 (m units)
Chart 38: HiSilicon AP shipment share by architecture, 2014-2015
Chart 39: Huawei P7 is first high-end product adopting a proprietary HiSilicon solution
Chart 40: Huawei product shipments based on HiSilicon solutions, 2014-2016 (m units)
Chart 41: Rockchip proprietary solution shipments, 2014-2016 (m units)