CONNECT WITH US

Global server shipment forecast and industry analysis, 2020

Staff writer
Staff writer
Digitimes Research estimates that global server shipments moderately declined 1.4% in 2019 but will turn to show positive growth of 6.6% in 2020, totaling 16.01 million units.
Abstract
Global server shipments, 2015-2020 (k units)

Taiwan-based server manufacturers' revenues generated from server-related business, including motherboards, racks, storage devices and network equipment, kept growing to reach NT$887 billion (US$29.64 billion) in 2019, up 2.3% year-over-year. Their revenues outperformed their shipments (down 1.4% year-over-year) mainly due to enhanced product spec and increased sales of storage and network devices.

Going forward into 2020, rebounding market demand will boost Taiwan-based server manufacturers' revenues by 6%-7% year-over-year. Server shipments will also resume growth. Both Taiwan-based manufacturers' shipments and global shipments will show over 6-8% increases.

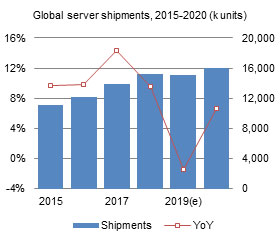
In terms of server shipments, as some customers placed more orders than what they actually needed over the past two years, they turned more conservative with their orders in 2019, resulting in a decline in global server shipments. Going forward into 2020, after a year of inventory depletion, server shipments will likely exhibit positive growth. As a matter of fact, the market was already showing signs of recovery from both the customer and manufacturer sides in fourth-quarter 2019.

The growth in server demand in 2019 still came mainly from US-based large-scale data center operators including Facebook and Amazon. China-based vendors including Lenovo and Inspur also showed strong demand/shipments as they benefited from Huawei's lost market share due to the US trade ban. Looking into 2020, US-based large-scale data center operators will still be the major force driving server shipments while Huawei will recover lost ground.

Table of contents
  • Introduction

  • Taiwan server-related revenues

  • Chart 1: Taiwan server-related revenues, 2015-2020 (NT$b)

  • Chart 2: Taiwan server-related revenues by maker, 2014-2019 (NT$b)

  • Chart 3: Taiwan server-related revenue share by maker, 2014-2019

  • Global server shipments

  • Chart 4: Global server shipments, 2015-2020 (k units)

  • Global shipments by client type

  • Chart 5: Global server shipments by client type, 2015-2020 (k units)

  • Chart 6: Global server shipment share by client type, 2015-2020

  • Global shipments by client

  • Chart 7: Global server shipments by client, 2015-2020 (k units)

  • Taiwan server shipments

  • Chart 8: Taiwan server shipments, 2015-2020 (k units)

  • Taiwan shipments by maker

  • Chart 9: Taiwan server shipments by maker, 2015-2020 (k units)

  • Chart 10: Taiwan server shipment share by maker, 2015-2020

  • Maker-client relationship

  • Chart 11: Taiwan maker-client shipment matrix, 2019 (k units)

  • Chart 12: Taiwan maker-client shipment matrix, 2018 (k units)

  • Chart 13: Vendor order distribution share, 2019

  • Chart 14: Vendor order distribution share, 2018

  • Chart 15: Taiwan maker-client shipment share matrix, 2019

  • Chart 16: Taiwan maker-client shipment share matrix, 2018

  • Shipments breakdown

  • Inventec

  • Chart 17: Inventec server revenue share, 2015-2019

  • Chart 18: Inventec server shipments, 2015-2020 (k units)

  • Chart 19: Inventec server shipments by client, 2015-2019 (k units)

  • Wistron Group

  • Chart 20: Wistron server revenue share, 2015-2019

  • Chart 21: Wistron server shipments, 2015-2020 (k units)

  • Chart 22: Wistron server shipments by client 2015-2019 (k units)

  • Foxconn

  • Chart 23: Foxconn server revenue share, 2015-2019

  • Chart 24: Foxconn server shipments, 2015-2020 (k units)

  • Chart 25: Foxconn server shipments by client, 2015-2019 (k units)

  • Quanta

  • Chart 26: Quanta server revenue share, 2015-2019

  • Chart 27: Quanta server shipments, 2015-2020 (k units)

  • Chart 28: Quanta server shipments by client, 2015-2019 (k units)

  • Mitac

  • Chart 29: Mitac server revenue share, 2015-2019

  • Chart 30: Mitac server shipments, 2015-2020 (k units)

  • Chart 31: Mitac server shipments by client, 2015-2019 (k units)

  • 2019-2024

  • Server market

  • Market trends

  • Table 1: Server market trends, 2020-2024

  • Global server shipments

  • Chart 32: Global server shipments, 2017-2024 (k unit)

  • Cloud datacenter

  • Hybrid cloud architecture

  • Table 2: Modern hybrid cloud architecture

  • Hyper-converged infrastructure

  • AI support

  • Table 3: AI model training and inference applications in servers

  • Network speed (Datacenter servers)

  • Chart 33: Datacenter server shipment share by network speed, 2019-2024

  • Table 4: Datacenter server network speed detail

  • Network speed (Enterprise servers)

  • Chart 34: Enterprise server shipment share by network speed, 2019-2024

  • Table 5: Enterprise server network speed detail

  • TABLES AND CHARTS

    Download Full Report (subscription required)

    Published: January 10, 2020

    Pick an option that is right for you

    Single Report
    • US$2,100
    Team or Enterprise Subscription
    Inquire
    Have a Question?
    consultant
    Customized Market Research Services
    We can customize the research to meet your specific needs, helping you make strategic and profitable business decisions.
    Sample Reports
    Connect with a Consultant