CONNECT WITH US

Coronavirus impact special report: Mobile devices

Jim Hsiao
Jim Hsiao
The coronavirus outbreak has disrupted production and weakened consumer confidence, with all ICT sectors bracing for major declines in shipments. Digitimes Research has conducted analyses on three mobile device sectors, namely notebooks, smartphones and tablets in the wake of the outbreak. The Special Report offers the latest updates about production statuses and shipments outlook for 2020 for each of the three sectors.
Abstract
The coronavirus outbreak has disrupted production and weakened consumer confidence

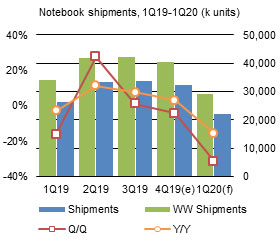
Global notebook unit shipments for the first quarter of 2020 are estimated to experience a sharp sequential fall of 29-36% than the 17% projected earlier, as severe labor and components shortages and stagnant logistics arising from the coronavirus outbreak are derailing the supply chain in China, which commands over 90% of global notebook production.

Global smartphone shipments are expected to slip below 1.3 billion units in 2020, including less than 200 million units of 5G models, taking into account the impacts of the outbreak on China and around the world in terms of economic growth.

Among IT product supply chains, the tablet sector has experienced less impact from the epidemic as most tablet factories had remained in production during the Lunar New Year holiday, while those located in regions less affected by the virus have begun resuming production since February 10. In general, the tablet sector is witnessing better capacity recovery than the notebook and smartphone sectors.

Table of contents
  • Introduction

  • Introduction

  • Chart 1: Notebook shipments, 4Q18-1Q20 (k units)

  • Chart 2: Global notebook shipments, 4Q18-1Q20 (k units)

  • Shipments breakdown

  • Chart 3: Shipments by major client, 4Q18-1Q20 (k units)

  • Chart 4: Shipment share by major client, 4Q18-1Q20

  • Chart 5: Global shipments by major vendor, 4Q18-1Q20 (k units)

  • Chart 6: Shipments by CPU, 4Q18-1Q20 (k units)

  • Chart 7: Shipment share by CPU, 4Q18-1Q20

  • Chart 8: Shipments by screen size, 4Q18-1Q20 (k units)

  • Chart 9: Shipment share by screen size, 4Q18-1Q20

  • Chart 10: Shipments by maker tier, 4Q18-1Q20 (k units)

  • Chart 11: Shipment share by maker tier, 4Q18-1Q20

  • Chart 12: Top maker shipments, 4Q18-1Q20 (k units)

  • Chart 13: Vendor-maker partnership, 4Q19 (k units)

  • Chart 14: Vendor-maker partnership, 3Q19 (k units)

  • Chart 15: Chromebook shipments, 4Q18-1Q20 (k units)

  • Important factors

  • Key factors affecting notebook shipments in 1Q20

  • Table 1: Key factors affecting 1Q20 notebook shipments by coronavirus outbreak

  • Table 2: ODM capacity recovery timeline and components supply status

  • Table 3: ODM capacity by location, February 2020 (k units)

  • Annual shipments

  • Chart 16: Taiwan and global notebook shipments, 2015-2019 (k units)

  • Chart 17: Top maker shipments, 2016-2019 (k units)

  • Chart 18: Global shipments by major vendor, 2016-2019 (k units)

  • Smartphone

  • Introduction

  • Table 4: Key supply factors affecting 1Q20 smartphone shipments in China

  • Table 5: Key supply factors affecting 1Q20 smartphone shipments in China (part 2)

  • Table 6: Key demand factors affecting 1Q20 smartphone shipments in China

  • Shipments breakdown

  • Chart 19: China top-4 smartphone brand shipment estimates, 1Q20 (m units)

  • Chart 20: Global smartphone shipment estimates, 2020 (m units)

  • Chart 21: China and global 5G smartphone shipment estimates, 2020 (m units)

  • Chart 22: China and global 5G smartphone penetration rate estimates, 2020

  • Tablet

  • Introduction

  • Table 7: Key factors affecting tablet shipments, 1Q20 (Brand)

  • Global tablet

  • Chart 23: Global tablet shipments, 4Q18-1Q20 (m units)

  • Shipment breakdown

  • Chart 24: Shipments by product - iPad, non-iPad branded and white-box, 4Q18-1Q20 (m units)

  • Chart 25: Shipment share by product - iPad, non-iPad branded and white-box, 4Q18-1Q20

  • Chart 26: Shipments by vendor, 4Q18-1Q20 (m units)

  • Chart 27: Shipment share by vendor, 4Q18-1Q20

  • Chart 28: Shipments by panel size, 4Q18-1Q20 (m units)

  • Chart 29: Shipment share by panel size, 4Q18-1Q20

  • Chart 30: Shipments by touchscreen technology, 4Q18-1Q20 (m units)

  • Chart 31: Shipment share by touchscreen technology, 4Q18-1Q20

  • Chart 32: Shipments by OS, 4Q18-1Q20 (m units)

  • Chart 33: Shipment share by OS, 4Q18-1Q20

  • Chart 34: Shipments by AP supplier, 4Q18-1Q20 (m units)

  • Chart 35: Shipment share by AP supplier, 4Q18-1Q20

  • Chart 36: Detachable notebook shipments, 4Q18-1Q20 (k units)

  • Chart 37: Shipments of detachable notebooks by OS, 4Q18-1Q20 (k units)

  • Chart 38: Shipments from Taiwan makers and share of global shipments, 4Q18-1Q20 (m units)

  • Chart 39: Taiwan tablet shipments by maker, 4Q18-1Q20 (m units)

  • Chart 40: Taiwan tablet shipment share by maker, 4Q18-1Q20

  • China tablet industry

  • Chart 41: Apple iPad shipment share by model, 2019

  • TABLES AND CHARTS

    Download Full Report (subscription required)

    Published: February 27, 2020

    Pick an option that is right for you

    Single Report
    • US$640
    Team or Enterprise Subscription
    Inquire
    Have a Question?
    consultant
    Customized Market Research Services
    We can customize the research to meet your specific needs, helping you make strategic and profitable business decisions.
    Sample Reports
    Connect with a Consultant