CONNECT WITH US

Global mobile device shipment forecasts, 2022 and beyond: Smartphones, notebooks and tablets

Jim Hsiao
Jim Hsiao
Although global notebook demand will decelerate in 2022 and 2023, their shipments will regain momentum starting 2024, while the global smartphone market is expected to enjoy shipment growth every year from 2022-2026. Global tablet shipments will see a moderate growth in 2021, but will shrink in each of the next five years starting 2022.
Abstract
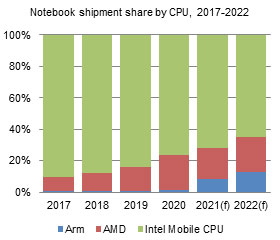
Shipment share by CPU, 2017-2022

Global notebook shipments are expected to experience minor declines in 2022 and 2023 as governments will start cutting their COVID-19 subsidies and stimulus checks with the easing of the pandemic, reducing overall demand for notebooks. However, the market is expected to see the next wave of shipment growth between 2024 and 2026 with upgrades to panels and hardware.

Meanwhile, Digitimes Research expects global smartphone shipments to increase 4.7% on year and arrive at 1.3 billion units in 2021 and will see on-year growths between 4-7% every year in the next five years from 2022-2026.

Tablet brands will see a more stable market environment in 2022 with their shipments in the year to pick up moderately by 1.3% from 2021. Although tablet brands will start pushing into the creator market to seek more business opportunities, overall tablet shipments are still likely to shrink over the next five years until 2026.

Table of contents
  • Smartphone introduction

  • Key factors affecting 2022-2026 worldwide smartphone shipments

  • Table 1: Key factors affecting 2022-2026 worldwide smartphone shipments

  • Smartphone shipment breakdown

  • Global shipments

  • Chart 1: Global smartphone shipments, 2021-2026 (m units)

  • China

  • Chart 2: Shipment to China and non-China markets, 2020-2022 (m units)

  • Top-7 vendors

  • Chart 3: Top-7 smartphone vendors' shipments, 2021-2022 (m units)

  • Shipments by OS

  • Chart 4: Shipments by OS, 2020-2022 (m units)

  • Chart 5: Shipment share by OS, 2020-2022

  • 5G smartphone

  • Chart 6: Shipments by 5G and non-5G, 2021-2026 (m units)

  • Foldable display smartphone

  • Chart 7: Shipments by foldable display feature, 2021-2026 (m units)

  • Global production capacity

  • Table 2: Global smartphone production capacity deployment 2021-2026

  • Quarterly breakdown

  • Chart 8: Top smartphone vendors' shipments, 4Q20-4Q21 (m units)

  • Notebook introduction

  • Notebook shipment breakdown

  • Global shipments

  • Chart 9: Global notebook shipments, 2020-2026 (m units)

  • Panel technology

  • Chart 10: Shipment share by panel technology, 2020-2026

  • Arm architecture

  • Chart 11: Arm-based notebook shipments by type, 2020-2024 (k units)

  • Key factors affecting 2022 global notebook shipments

  • Table 3: Key factors affecting 2022 worldwide notebook shipments (supply side)

  • Table 4: Key factors affecting 2022 worldwide notebook shipments (demand side)

  • Chromebooks

  • Chart 12: Chromebook shipments, 2017-2022 (k units)

  • CPU

  • Chart 13: Shipment share by CPU, 2017-2022

  • Vendor

  • Chart 14: Shipments by top vendors, 2020-2022 (m units)

  • Tablet introduction

  • Key factors affecting 2022 worldwide tablet shipments

  • Table 5: Key factors affecting worldwide tablet shipments in 2022 (supply and demand)

  • Component shortages

  • Table 6: Key factors affecting worldwide tablet shipments in 2021 and 2022 (component shortages)

  • Tablet shipment breakdown

  • Global shipments

  • Chart 15: Global tablet shipments, 2019-2026 (m units)

  • Brand tablets in 2H21

  • Table 7: Brand vendor tablets in 2H21

  • White-box shipments

  • Chart 16: Shipments by brand and white-box player, 2017-2022 (m units)

  • Size

  • Chart 17: Brand shipments by size, 2020-2022 (m units)

  • Chart 18: Brand shipment share by size, 2020-2022

  • Brand vendors

  • Chart 19: Brand shipments by vendor, 2017-2022 (m units)

  • Chart 20: Brand shipment share by vendor, 2017-2022

  • Apple

  • Chart 21: Apple tablet shipments, 2017-2022 (m units)

  • Taiwan ODM

  • Chart 22: Brand shipments by Taiwan ODMs, 2017-2022 (m units)

  • TABLES AND CHARTS

    Download Full Report (subscription required)

    Published: October 21, 2021

    Pick an option that is right for you

    Single Report
    • US$1,300
    Team or Enterprise Subscription
    Inquire
    Have a Question?
    consultant
    Customized Market Research Services
    We can customize the research to meet your specific needs, helping you make strategic and profitable business decisions.
    Sample Reports
    Connect with a Consultant