Digitimes Research predicts there will be a total of 389 million large-sized (9 inches and above) TFT LCD panels shipped in the second half of 2012, with 195 million in the third quarter and 194 million in the fourth quarter - with the total representing a 7.6% increase over the first half of this year. These estimates aren't ideal for the panel market and can be attributed to a lack of demand momentum for LCD TVs, LCD monitors, notebooks and 9-inch and above tablets in the second half of the year.
Chart 2: Apple's new iPad uses a-si TFT LCD panels due to Sharp IGZO panel delays
Table 1: Factors affecting global 2H12 large-size LCD panel shipments
Chart 5: 90% of 50-inch panels to be provided by Taiwan-based panel makers in 2H12
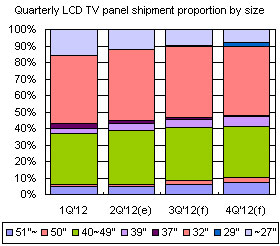
Chart 6: LCD TV panel shipment share by segment size, 1Q12-4Q12
Chart 7: LCD TV panel backlight share by technology, 4Q09-4Q12
Chart 8: Number of TV models by vendor certified for China’s energy subsidies
Chart 9: Subsidy money allocated for TV sizes (CNY) per unit
Chart 10: Ultra high-resolution notebooks from Apple in 2H12 (Pixel Per Inch)
Chart 12: The 7-inch tablet segment in China gains popularity in 2012
Table 2: Shipments of tablets under 9 inches, 2012 (m units)
Chart 15: Global handset and smartphone shipments, 2012 (m units)
Chart 16: China smartphone brands focus on low and mid-end products
Chart 18: Smartphone panels shipments by resolution (m units)
Chart 19: Handset panel shipments and AMOLED penetration (m units)
Chart 20: Shipments of AMOLED panels by resolution (m units)
Chart 21: Large-size LCD panel shipments, 4Q11-4Q12 (k units)
Chart 22: Quarterly large-size LCD panel shipment growth, 2007-2012
Chart 23: LCD panel shipments by product segment, 4Q11-4Q12 (k units)
Chart 24: LCD panel shipment share by product segment, 4Q11-4Q12
Chart 25: LCD TV panel shipments by maker,1Q12-4Q12 (k units)
Chart 26: Global LCD monitor panel shipments by maker,1Q12-4Q12 (k units)
Table 5: LCD notebook panel shipment share by maker, 2H 2012
Chart 27: Global notebook panel shipments by maker,1Q12-4Q12 (k units)
Table 6: Large-size tablet panel shipment share by maker, 2H 2012
Chart 28: Gobal large-size tablet panel shipments by maker,1Q12-4Q12 (k units)
Chart 29: LCD tablet panel shipments by Top-5 makers, 1Q12-4Q12 (k units)
Chart 30: Overall LCD tablet panel shipments by maker,1Q12-4Q12 (k units)
Chart 31: Mid-size (below 9 inches) panel shipments by maker,1Q12-4Q12 (k units)
Chart 32: Taiwan panel makers' large-size panel shipments, 4Q11-4Q12 (k units)
Chart 33: Taiwan large-size LCD panel shipments by product segment, 4Q11-4Q12 (k units)
Chart 34: Taiwan large-size LCD panel share by product segment, 4Q11-4Q12 (k units)
Table 8: Factors affecting 2H12 global large-size LCD panel shipments
Chart 35: Global TFT LCD production capacity, 1Q11-4Q12 (k square meters)
Chart 36: LCD production capacity by region, 2009-2012 (Km2)
Chart 37: Quarterly LCD TV panel shipments for three China-based panel makers, 2012 (k units)
Chart 38: LG Display LGD P98 8.5G plant, production by technology (k units/month)
Chart 39: Foxconn's improved 10G production line will affect CMI
Chart 41: Operating profit rates for major LCD makers, with Samsung including SMD,1Q11-2Q12
Chart 42: Operating profit rates for major LCD makers, with Samsung not including SMD,1Q11-2Q12
Chart 43: Average large TFT LCD panel prices by segment, July11-Dec12 (US$)
Chart 44: Panel prices for TFT LCD panel used in tablets, 4Q11, 4Q12 (US$)
Chart 45: Panel prices used in hanesets (including smartphones), 4Q11, 2Q12 (US$)
Chart 46: Sharp's acquired debt and net worth ( billion Japanese Yen)
Chart 47: Large-size TFT LCD production capacity share, by region

