
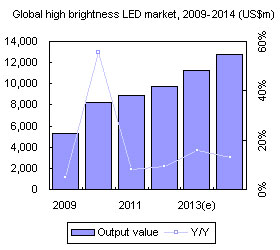
Digitimes Research estimates that the production value for high brightness LED chips will have an annual growth rate of 12.9% and reach US$12.74 billion in 2014. The applications that will drive growth momentum are LED lighting, tablet, mobile, and automotive. For the global LED lighting market, the market size will reach US$25.82 billion in 2014 or a market penetration rate of 23.4%. This is attributable to exponential shipment growth for light bulbs, tubes, and directional lamps. With pricing trending downward, the annual LED lighting output value will grow 38.8%.
Chart 1: Global high brightness LED market, 2009-2014 (US$m)
Chart 2: High brightness LED application shipments by application, 2013-2014 (US$m)
Table 1: Factors for high brightness LED application product shipment rate changes from 2013 to 2014
Chart 3: High brightness LED application shipment share changes, 2013-2014
Chart 4: High brightness LED market, share by application, 2009-2014
Chart 6: Market share penetration rates for various LED lighting applications, 2013-2014
Chart 7: Global LED lighting market production value, and penetration rates, 2009-2014 (US$m)
Chart 9: Appropriate LED bulb light distribution angles for various areas
Chart 10: Light angle distribution changes for LED bulbs, 2012-2014
LED bulb luminous efficiency share distribution changes in 2014
Chart 11: LED light bulb efficiency improvement progress, 2013-2017
Chart 12: LED bulb luminous efficiency changes, 2012-2014 (lm/W)
Lumens per unit price changes for brand name LED bulbs in 2014
Chart 13: Lumens per unit price changes for brand name LED bulbs, 2012-2014 (Lm/US$)
Chart 14: Color rendering and spectral distribution comparisons for various lights
Chart 15: Color rendering requirementscorresponding to various application areas
Cost and spec comparisons for LED bulbs, by lighting manufacturer
Table 2: Cost performance and specification comparisons for major brand 60W grade bulbs
Chart 17: Bulb shipment breakdown by region, for all technologies (13b units)
Chart 19: Global LED bulb market penetration rate, 2011-2014
Evolution of LED light tube specifications, by applicable areas
Chart 20: Various LED light tube market segments and performance requirements
Table 4: Three LED specification tiers that will replace traditional fluorescent lights
Chart 21: Performance requirements for four foot LED light tube specifications
Chart 22: Four foot LED light tube specs, and corresponding power savings
Chart 23: List of LED light tube technology developments in the near future
Chart 24: LED light tube luminous efficiency progress compared with DOE targets
Four foot T8 LED light tube price changes and 2014 market forecast
Chart 25: Four foot T8 LED light tube pricing, 2011-2014 (US$)
Chart 26: Lighting tube shipment share by region, for all technologies (total of 4b units)
Chart 27: Breakdown in US fluorescent tube market, by specification
Chart 28: European lighting industry's viewpoint on T8/T5 LED light tubes
Chart 30: Global LED light tube market penetration rate, 2011-2014
Chart 31: Future specifications and market developments for LED directional lamps
Chart 32: Directional lamp shipment share by region, all technologies (4.5b total)
Chart 33: Power consumption and potential energy savings by LEDs in Japan (kWh b)
Chart 34: Power consumption and potential energy savings by LEDs worldwide (kWh b)
Chart 35: Performance comparison for various sources of commercial lighting
Table 5: Specification requirements and comparison for LED directional lamps
Table 6: Comparison of various LED commercial lighting component
Chart 37: Commercial application examples of various LED type light sources
Chart 38: Global LED directional lamp market shipments, 2011-2014 (m units)
Chart 39: Global LED directional lamp market penetration rate, 2011-2014
Table 7: National LED street lighting plans for major regions
Table 8: LED streetlight installation plans for the Guangdong province of China
Table 9: LED streetlight installation plans for the major provinces and cities in China
Chart 40: China's LED streetlight market, 2009-2014 (k units)
Chart 41: Global streetlight share by region, for all technologies (200m units)
Chart 43: Global LED streetlight shipments, and installation base, 2011-2014 (k units)
