Subscribe to Research Taiwan FPD Tracker to read this report or purchase it separately. Subscribe Now
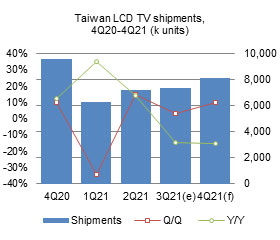
 Taiwan's LCD TV shipments increased only 2.9% sequentially to come to 7.37 million units in the third quarter of 2021.
Table of contents
 Taiwan's LCD TV shipments increased only 2.9% sequentially to come to 7.37 million units in the third quarter of 2021.