
Digitimes Research projects that the global high-brightness LED industry will see year-on-year growth of 13.4% in 2012, with output rising to US$10.1 billion. The main reason for this is the huge drop in MOCVD demand to just 200 units for the whole of 2012, combined with the weakness of the LED industry in the first half of 2012. These factors make it unlikely that the industry will be able to return to the high levels of growth seen in 2010, while installations of new MOCVD equipment are likely to be concentrated in the second half of 2012.
Japan, South Korea and Taiwan will together account for some 61.3% of the high-brightness LED market in 2012, and it is therefore fair to say that the trend towards Asian dominance of the LED industry is becoming even more pronounced. China will see growth as high as 30% as 150 MOCVD units, the delivery of which was delayed, finally commence production in 2012; however, it is worth noting that the China industry remains centered on medium- to low-power LEDs.
In terms of applications for high-brightness LEDs, large-size LED backlights will remain the biggest sector with 34.1%, with lighting trailing behind with 16.7%; however, Digitimes Research forecasts that by 2014 the situation will be reversed, with large-size LED backlights accounting for 28.7% and lighting for 33.4%.
The LED light bulb market will continue to grow rapidly in 2012, with new products largely consisting of replacements for 60W incandescent bulbs. It is worth noting, however, that the price of 60W replacement bulbs with a brightness of 800lm currently remains high at around US$40. Moreover, the "sweet spot" in terms of pricing versus demand differs widely between regions, from US$25 in Japan and US$15 in Europe and North America, to as little as US$7 in emerging nations. For this reason, conventional energy-saving light bulbs will continue to account for a high proportion of the market in 2012, while the penetration rate for LED light bulbs will reach 5.4%, equivalent to shipments of 1.05 billion bulbs.
Despite only achieving a penetration rate of 6.6% in the overall lighting market in 2011, LED lighting has enormous potential for growth. Many countries have launched incentive and subsidy policies to spur on the development of LED lighting. Japan has set a 2015 target for LED lighting as a proportion of the general lighting market of 50%, while South Korea has set a 2015 target of 30% and China has set a 2015 target of 20%; measures to meet these targets will be introduced in phases. LED technology also continues to improve, with the US Department of Energy (DOE) setting a target for white light LED components to achieve a luminous efficacy of 200lm/W by 2014, while prices are projected to fall to US$2/klm; manufacturers' own technical progress is likely to be ahead of this schedule.
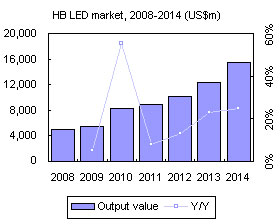
For all these reasons, Digitimes projects that global market penetration rates for LED lighting will rise from 11.3% in 2012 to 25.8% in 2014, while output value will grow from US$16.5 billion to US$41.9 billion over the same period.
Chart 2: Projected regional distribution of the 2012 HB LED market
Chart 4: Obama's goal is for 80% of US electricity to come from clean sources by 2035
Chart 6: Cost structure of various LED lighting products in 2011
Chart 7: Cost reduction targets for indoor embedded LED lighting, 2010-2020
Chart 8: Cost reduction targets for LED package costs, 2010-2020
Table 2: Development targets for luminous efficiency and pricing of white LEDs, 2010-2020
Chart 9: Japan's post-disaster electricity supply/demand adjustment plan
Chart13: Focus of energy saving policy in Japan through 2025
Chart 15: LED lighting uptake in South Korea's public sector, 2010-2020
Table 7: Industrial convergence support centers in South Korea by region
Chart 18: Comparison of plans to phase out incandescent lights in China and other countries
Chart 19: Cree's annual revenues and pre-tax net profits for the 2007-2011 accounting years (US$m)
Chart 20: Proportion of Cree's revenues coming from LEDs during the 2007-2011 accounting years
Chart 21: Cree's major upstream, midstream and downstream LED lighting-related products
Chart 22: Luminous efficacy of prototype and mass-produced high-power white light LEDs
Chart 24: Sales share by region during the company's 2011 accounting year
Chart 25: China-based companies that signed partnership agreements with Cree in 2011
Chart 26: Overview of Cree's involvement in demonstration projects in China
Chart 28: Osram's revenues and pre-tax net profits during its 2007-2011 accounting years (EURm)
Chart 29: Osram is expanding LED factory facilities in Malaysia and Germany
Chart 30: Maximum luminous efficacy ratings for Osram's 2011 LED package products for lighting use
Chart 31: Osram's current and target energy efficiency ratings for LED flat light sources
Chart 32: Osram's current and target energy efficiency ratings for OLED flat light sources
Chart 34: Philips lighting sales by application sector, 3Q11
Chart 37: Philips projects that 2012 LED lighting revenues in Japan will reach JPY13b
Table 9: Sale prices of Philips' LED lighting products in different regions (US$)
Chart 40: Effects of Panasonic's restructuring of its LED lighting business
Chart 41: Panasonic's LED lighting sales and forecasts for the 2009-2015 accounting years (JPYb)
Chart 42: Panasonic's LED lighting overseas sales targets for the 2015 accounting year (JPYb)
Chart 43: Panasonic's plans to expand into new types of product in Japan
Chart 44: Panasonic's global strategic presence in the LED lighting market
Chart 45: Regional distribution of overseas sales of Panasonic's LED lighting products
Chart 46: Panasonic's all-in-one lighting service development strategy
Chart 48: Japanese LED lighting manufacturers' market share by revenues, 2010
Chart 50: Toshiba Lightech's overseas presence in 2012 and 2013
Chart 51: Toshiba's LED lighting collaboration with the Louvre
Chart 53: Sharp's 2011 revenue increase/decrease projections and LED lighting sector presence
Chart 54: Japan's second tier lighting manufacturers' sales plans and presence, present-2015
Chart 56: Post-merger cooperation between Samsung's LED division and Samsung Electronics
Chart 57: Samsung Electro-Mechanical's investment in its LED business, 2010-2011(KRWb)
Chart 59: Lighting applications as a share of Samsung LED's revenues, mid-year 2009-2011
Table 10: Prices of LED light bulbs from Samsung LED and LG Electronics in South Korea
Chart 62: Samsung Group's Green Intelligent Building solutions
Chart 63: Samsung Group's overseas development plans for green buildings
Chart 64: LG Group's green energy business revenue targets, 2010-2013 (KRWt)
Chart 65: LG Innotek's LED business as a proportion of overall revenues, 2006-3Q11 (KRWb)
Chart 66: LG Innotek's LED division revenues by application, 1Q11-3Q11
Chart 67: LG Innotek's capital expenditure on its LED business, 2010-2011(KRWb)
Chart 68: Production efficiency and costs for 6-inch and 2-inch LED epitaxial wafers
Chart 69: LG Corp's domestic and overseas LED lighting market share targets for 2015
Chart 72: Seoul Semi's revenue and profits, 2008-2011 (KRWb)
Chart 73: Seoul Semi's revised revenue forecasts by product sector (KRWb)
Chart 74: Specifications of Seoul Semi's Acrich 2 lighting LED components
Chart 75: Prospects for the global vehicle use LED market, 2010-2015
Chart 77: LED market size and LED lighting penetration rate, 2009-2014 (US$m)
