Digitimes Research estimates that Taiwan's TSMC and UMC ranked first and second worldwide among the world's top 10 foundries in 2010. TSMC's subsidiary Vanguard International Semiconductor also ranked among the top 10.
In addition, Taiwan is home to other foundries such as Episil Technologies, Advanced Microelectronic Products and Maxchip Electronics. Taiwan's foundry industry accounted for an estimated 68.5% of global foundry revenues in 2010. In addition, China accounted for 12-13% of global revenues, bringing the share of Greater China to over 80%.
Of the top 10 semiconductor manufacturers in China, Hynix-STM and BCD Semiconductor Manufacturing are a memory maker and an IDM (Integrated Device Manufacturer), respectively, while the other eight are pure-play foundry players including Semiconductor Manufacturing International (SMIC), Grace Semiconductor Manufacturing (GSMC), Shanghai Hua Hong NEC Electronics (Hua Hong NEC) and Hejian Technology (Suzhou).
While SMIC and GSMC ranked fourth and tenth globally in 2010, China-based foundries tend to be less competitive in cost and are unable to meet demand for leading-edge applications. However, China-based foundries have the advantage of geographical proximity to emerging markets.
Faced with the vigorous challenges of Samsung Electronics and Globalfoundries, TSMC and UMC raised their capital outlay in 2010 for expanding 12-inch wafer capacity and accelerating the pace for the R&D and mass production of cutting-edge technology.
Digitimes Research forecasts that the output value of Taiwan's foundry industry will reach US$22.14 billion in 2013, while the China foundry industry may top US$4.45 billion.
Table 1: Major China IC foundries: Monthly capacity and process technologies
Table 2: Major Taiwan IC foundries: Monthly capacity and process technologies
Chart 1: SMIC capacity, 1Q08-3Q10 (8-inch equivalent wafers, k units)
Chart 2: SMIC revenues by geographic region, 1Q08-3Q10 (US$m)
Chart 5: SMIC revenue share by process technology, 1Q08-3Q10
Chart 6: SMIC revenues by process node type: Micron and submicron
Chart 7: TSMC China capacity, 1Q08-4Q10e (8-inch equivalent k units)
Chart 8: TSMC capacity, 1Q08-4Q10e (8-inch equivalent k units)
Chart 9: TSMC revenue share by process technology, 1Q08-3Q10
Chart 10: TSMC revenues by process node type: Micron and submicron, 1Q08-3Q10 (US$m)
Chart 11: TSMC revenues by geographic region, 1Q08-3Q10 (US$m)
Chart 14: TSMC capacity and actual output, 1Q08-4Q10e, (8-inch equivalent k units)
Chart 15: UMC capacity, 1Q08-4Q10e, (8-inch equivalent k units)
Chart 16: UMC revenue share by process technology, 1Q08-3Q10
Chart 17: UMC revenues by process node type: Micron and submicron, 1Q08-3Q10 (US$m)
Chart 18: UMC revenues by geographic region, 1Q08-3Q10 (US$m)
Chart 20: UMC revenue breakdown by client type, 1Q08-3Q10 (US$m)
Chart 21: VIS revenue share by process technology, 1Q08-3Q10
Chart 23: VIS shipments by application, (8-inch equivalent k units)
Chart 28: Top-3 Greater China foundries: Revenues, 1Q08-4Q10e (US$m)
Chart 29: Top-4 Greater China foundries: Revenues by geographic region, 1Q08-4Q10e (US$m)
Chart 30: Top-4 Greater China foundries: Revenues by application, 1Q08-4Q10e (US$m)
Chart 31: Top-4 Greater China foundries: Revenues by customer type, 1Q08-4Q10e (US$m)
Chart 32: Top-3 Greater China foundries: Revenues from IDM orders, 1Q08-3Q10 (US$m)
Chart 33: Top-3 Greater China foundries: Revenues by process technology, 1Q08-3Q10 (US$m)
Chart 34: Top-3 Greater China foundries: Revenue share by process technology, 1Q08-3Q10 (US$m)
Chart 37: Top-3 Greater China foundries: Revenues from 65nm and below processes, 3Q09-3Q10 (US$m)
Chart 39: Top-4 Greater China foundries: Capacity, 1Q08-3Q108 (8-inch equivalent k units)
Chart 41: Top-4 Greater China foundries: Utilization rates, 1Q08-3Q10
Chart 42: Greater China foundries: ASP, 1Q08-3Q10 (US$ per 8-inch wafer)
Chart 43: Top-4 Greater China foundries: ASPs, 1Q08-3Q10 (US$ per 8-inch wafer)
Chart 44: Global Top-4 vs. China foundries, capacity in 3Q10 (k wafers)
Chart 47: Major global foundries: Revenues and market share, 2007-2011
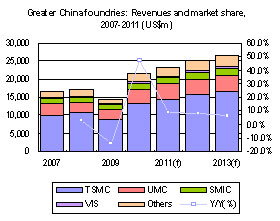
Chart 48: Greater China foundries: Revenues and market share, 2007-2011 (US$m)