

Subscribe to Research Global Tablet Tracker to read this report or purchase it separately. Subscribe Now
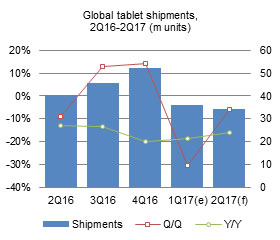 Cannibalized by large-size smartphones, global tablet shipments in first-quarter 2017 dropped 16.7% on year to reach 37.12 million units.
Table of contents
Table 1: Key factors affecting tablet shipments in 2Q17 (Supply)
Table 2: Key factors affecting tablet shipments in 2Q17 (Supply)
Table 3: Key factors affecting tablet shipments in 2Q17 (Demand)
Chart 2: Shipments by product - iPad, non-iPad branded and white-box, 1Q16-2Q17 (m units)
Chart 3: Shipment share by product - iPad, non-iPad branded and white-box, 1Q16-2Q17
Chart 8: Shipments by touchscreen technology, 1Q16-2Q17 (m units)
Chart 9: Shipment share by touchscreen technology, 1Q16-2Q17
Chart 14: Shipments of detachable notebooks by OS, 1Q16-2Q17 (k units)
Chart 15: Shipment share of detachable notebooks by OS, 1Q16-2Q17
Chart 16: Taiwan makers' shipments and share of global shipments, 1Q16-2Q17 (m units)
Chart 17: Taiwan tablet shipments by maker, 1Q16-2Q17 (m units)